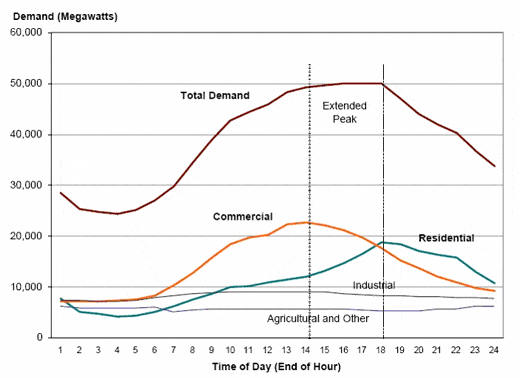
In order to have this discussion, it is necessary to look at electrical energy consumption patterns. Our energy sources have to match the timing of our consumption. The graphs below show the typical daily electrical energy consumption patterns for residential and commercial consumers.

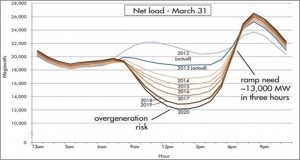
Overall peak energy consumption is from 2:00 PM to 6:00 PM. Residential peak consumption is from 4:00 PM to 10:00 PM. Peak solar PV production is typically from 9:00 AM to 3:00 PM. The majority of the solar PV energy is being produced during non-peak consumption hours. If the solar PV system is sized to provide base-loads only, this addresses part of the issue. However, it changes the load demand on the utility grid and makes it difficult to maintain stability of the grid voltage and frequency. The chart below shows the changes to the load demand when solar is added to the grid during the peak solar hours of the day.
2012 represents very little solar generation. Each year shows the actual added solar generation effect and projected solar generation effect on total load demand.
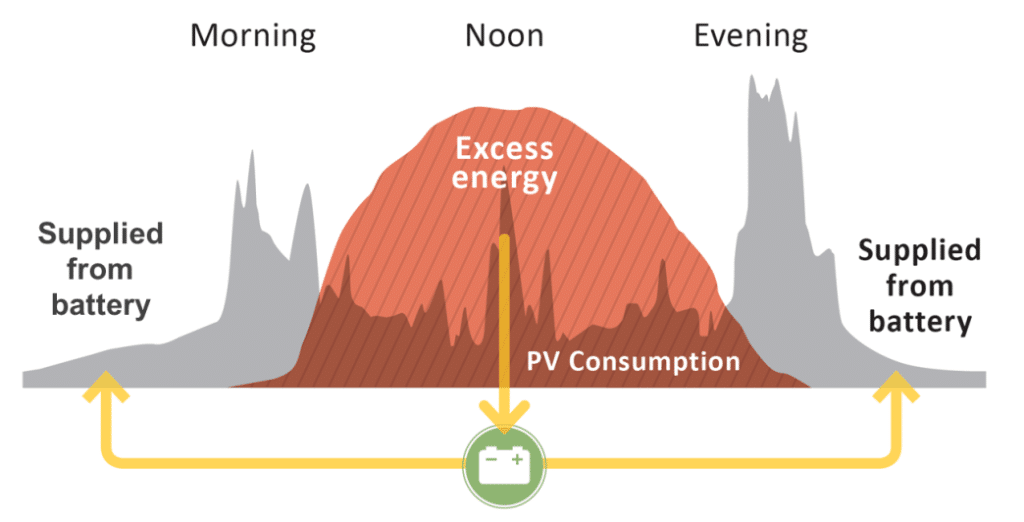
It becomes increasingly difficult and expensive for the utility to meet this type of demand load variation. One solution is to face the PV array toward the afternoon sun. This would help with overall consumption patterns but not for residential consumption patterns. It doesn’t address the issue of cloudy days with little or no solar PV generation. This brings in energy storage as the best solution. The energy storage capacity needs to be large enough to absorb the excess solar PV energy produced during peak solar hours.

Energy storage is the only real solution for solar PV to become a primary electrical energy generation source (EEGS). There are several types of energy storage: Batteries are the fastest growing type of energy storage with Lithium-ion being the leader of that group; the conversion efficiency is pretty high (80% to 90%). Pumped water storage has been used by utilities for this purpose in some sectors of the electrical grid; the energy conversion efficiency is a little lower (70% to 80%). Other forms of energy storage such as fuel cells and capacitors may develop further in the near future but they are not competitors at this time.
Battery storage is the most versatile means of energy storage and it is crossing the barrier of cost effectiveness for shifting loads to a different time of day. To effectively compete with the other EEGS, solar PV with energy storage must have a levelized cost of energy (LCOE) that is lower than the other sources. To calculate the LCOE, divide the total cost of energy by the energy generated during the life-cycle of the EEGS. Twenty-five years is the typical life cycle used for PV systems. The cost of energy includes initial cost and all operating costs during the period of analysis. The kilowatt hour of generation during the period of analysis must be de-rated for non-operational hours and the warranted degradation of the PV output.
Examples:
Residential:
8kW PV system with energy storage: Net Cost: $3.30/W = $26,400
8kW x 5 sun-hours x .85 x 365 days x 25 years x 90% = 279,225 kWh
$26,400 ÷ 279,225 = .094/kWh
Commercial:
500kW PV system with energy storage: Net Cost: $2.60/W = $1,300,000
500kW x 5 sun-hours x .85 x 365 days x 25 years x 90% = 17,451,562 kWh
$1,300,000 ÷ 17,451,562 = .0745/kWh
Utility:
20MW PV system with energy storage: Net Cost: $2.00/W = $40,000,000
20,000kW x 5 sun-hours x .85 x 365 days x 25 years x 90% = 698,062,500 kWh
$40,000,000 ÷ 698,062,500 = .0573/kWh
The above examples show LCOE rates that are competitive in some markets but not in all. The installed cost of solar PV is continuing to drop and the energy storage industry continues to improve and reduce costs. As these trends continue into the very near future, solar PV with energy storage will meet and beat the LOCE of most of its competitors in all markets.
Kelly Provence
Certified Master PV Trainer
CEO, Solairgen School of Solar Technology

